


Do you love graphs?
Here are some beautiful interactive sites to create graphs with your students:
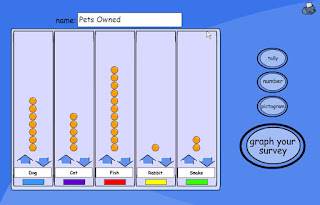
Simple Survey by Teacher LED:
Choose a topic (transportation, pets, TV, or food) and create a tally chart, pie graph, or bar graph with the data you collect as a class.

Create bar, line, area, pie, and XY graphs.
Make a Pictogram:Make a pictogram using images of flowers, people, cars, stars, boats, blocks, coach, bikes, trains, and computers. You can change the color of the images, as well.

How Far Away Do You Live? by I-Board:Create pins with your students name and place it on the graph to show how far away each child lives from school.


Create a Graph
Create A Graph:
Make image labels for your students and graph their birthday months.
Graph your students ´ favorite snacks.
Graph your students ´ favorite toys and activities.
Create your own tally chart, pie chart, bar chart, or pictogram by adding your own information and values.
Put in your titles and data to instantly create a pie chart.
Choose from given data to interpret the graph, or enter your own.
Choose from given data to interpret the graph or create your own.


Subscribe to:
Post Comments (Atom)
0 comments:
Post a Comment